Clickstream Data Warehousing
by Richard Li (richardl@arsdigita.com), Jon Salz (jsalz@mit.edu)
Submitted on: 2000-07-01
Last updated: 2000-08-14
ArsDigita : ArsDigita Systems Journal : One article
Planning, development, and promotion are the most obvious tasks
involved in building a web service. But analyzing how end users use a
service may be more important to that service's success. Understanding
how users reach your site and how they behave once they are there
allows you to improve future users' experiences with the site. It also
allows you to improve your ROI by increasing sales and increasing the
"stickiness" of user visits.
We turn to clickstreams, the streams of requests (clicks)
users generate as they move from page to page within a web site, to
provide this kind of information. Clickstreams contain a tremendous
amount of quantitative data that can be used to improve users'
experiences with a site. When properly mined, clickstream analysis
can provide answers to very specific questions such as:
- What are the most popular pages on a site? the most popular products?
- How do people arrive at the site? Where do they go when they
leave? How long do they stay?
- What percentage of sessions resulted in a sales transaction?
- Which pages on our web site seem to be "session killers," where
the remote user stops the session and leaves? Do a certain percentage
of people leave my web site with loaded shopping carts at a single Web
page?
- Which browsers and operating systems do visitors use?
- What are the most common paths users take throughout the site?
- How successful are various banner ad campaigns? How much do
people spend on my site if they arrived via a particular banner ad?
The answers tell us where to direct development and promotion
efforts in the future. If we find that particular services we've put a
lot of effort into are being neglected by users, we want to feature
them near the top of the site to improve their popularity. If we find
that users are leaving their shopping carts full at a certain point in
the E-commerce checkout process, we may want to hire a usability
consultant to simplify the UI so users will complete their
transactions.
The standard approach today to analyzing user behavior and usage on
a web site is through log file analysis of web server logs. Web
servers log each HTTP request into a text file in the filesystem; a
log file analyzer can analyze the log files and present the data in a
variety of useful ways. However, web server log files can only answer
a subset of the questions that can be answered by clickstream analysis
(see Chapter 9: User Tracking in Philip and Alex's Guide to Web
Publishing, http://www.arsdigita.com/books/panda/user-tracking).
Standard log file analyzers cannot provide the level of analysis
made possible by clickstream data warehousing for several
reasons. First, a standard log file does not contain all the
information that the web server knows about a visitor, such as user
identity. In addition, building a data warehouse for clickstream data
enables the clickstream data to be correlated from different sources.
For example, we can correlate the clickstream behavior of a particular
group of users to the dollar value they currently have in their
shopping cart.
Introduction to Data Warehousing
A data warehouse is a relational database whose goal is the
analysis of large amounts of data. This goal is distinct from the
other common use of databases, transaction processing, whose goal is
to maintain records of transactions. A data warehouse contains data
that is derived from transaction data, but may also include data from
other sources. A data warehouse is used to analyze data for patterns
and to answer questions that may not be asked until after the data are
actually available. In other words, a data warehouse must be a
flexible structure for storing vast quantities of data so that it can
be prepared to answer any question that may be posed to it, questions
that inevitably will not be anticipated at design time.
A star schema is the standard proven design for a data
warehouse. The heart of the star schema is the fact table, which has
one row for each fact in the system. Choosing the level of detail in
the information that goes into a particular row is known as
determining the granularity of the data warehouse. Each column of the
fact table is a foreign key that references a particular dimension;
data about a particular dimension is stored in dimension tables that
are joined with the fact table as needed. For instance, a data
warehouse for a consumer products retailer company might have a
granularity of one product sale per row. The dimensions of the data
warehouse may include which product was sold, where it was sold, the
price at which it was sold, and the date when it was sold. When a
query requires data from multiple dimensions, these dimensions are
joined by the database to form what appears to be one large table with
the necessary data.
The process of building a data warehouse can be broken down into
three phases: gathering data, data transformation and data warehouse
population, and querying the database. In the example above, the data
gathering process would collect data about every sale transaction,
store location, and any other data required by the data warehouse. The
data gathering process usually will require that data to be gathered
from multiple sources: sales information is collected from each
retailer, geographic information comes from a company database, and so
forth. The data transformation phase takes all the data gathered in
the previous step and loads the data into the warehouse. This process
reconciles any inconsistencies in the data (for example, data from one
source might use code BLU to indicate an item with the color blue,
while another source may use the code BLUE to mark the same
attribute), computes any necessary values from the raw data, and
populates the data warehouse with the processed data. The third phase
is targeted at the end user, and involves providing user interfaces
that allow users to query and analyze the data in the warehouse. Each
of these phases is actually an ongoing process; new data are
continually gathered, transformed, and analyzed.
Additional reading:
Design Goals
Four key considerations drive the design of the clickstream data
warehouse architecture.
- Performance and scalability On a heavily trafficked site,
tens or hundreds of millions of clicks can occur every day. This
enormous amount of data requires that the data model be robust enough
to support queries involving billions of rows of data, and that the
data population scheme is efficient and scalable.
- Transparency The system should be transparent to both the
end user and to the web developer once it is installed and properly
configured. If the system requires developers to adopt additional
coding practices to support clickstream logging, it will likely
provide inaccurate data or be unused.
- Tools-agnostic Different web sites use different
technologies; the clickstream system should not preclude the use of
any particular software. Moreover, integrating the clickstream system
on a live site should not require rearchitecting substantial parts of
the original web site. The particular implemetnation we discuss here
will rely on AOLserver and Oracle.
- Extensibility The system should support ad hoc queries into
a very large data warehouse without incurring substantial performance
penalties even if the query is written by an end user inexperienced in
tuning SQL.
Collecting and Analyzing Data
As mentioned before, clickstreams provide a tremendous amount of
data. We have one data point per hit to a site -- potentially
millions per day and billions per year -- so if we're not careful,
analyzing our data could be very expensive. Typically, the
life cycle of any particular data point is as follows:
- Immediately after the user requests a page on the web site, the
server writes a line to a log file containing very detailed
information about the request.
- Periodically a separate data warehousing server requests the
latest chunk of the log file, loading them into a event log table
(cs_event_log) in the Oracle database.
- Entries in the event log table are analyzed by the
clickstreaming core code in Oracle, which consists of a few thousand
lines of PL/SQL. This involves populating the dimensions -- page,
session, user agent, etc. -- and inserting a row into the data
warehousing fact table for each row in the event log table.
- Someone queries the data warehouse, obtaining
some sort of report.
Let's take a look under the hood at each of these steps.
Step 1: Event Logging
We use AOLserver filters (the ns_register_filter API) to trap
requests to HTML pages so we can log information about them to files
in the filesystem. Hits are generally logged into files with names
like servername-cs.log.2000-04-25.14:00 (this example
is for the period of time between 2:00 and 3:00 p.m. on 25 April
2000). Each line has the following fields:
- The time at which the page was requested
- The time at which the download of the page was completed
- The URL requested
- The IP address of the request
- The user ID of the user, if known
- The query string in the request URL
- The content type of the page delivered
- The number of bytes delivered
Every 24 hours, the individual clickstream logs are
concatenated into one large log file and compressed.
Step 2: Loading data into the warehouse
We use HTTP to transfer the compressed clickstream log files from the
production web server(s) to a dedicated data warehouse machine. We use
a dedicated data warehouse machine because we don't want to slow the
production web server down while we're populating the database, and
because we configure Oracle differently for data warehousing. Once the
clickstream logs have been transferred, we generate a SQL*LOADER .ctl
file and do a direct path load of the data into the
cs_event_log table.
Step 3: Populating the warehouse
Once there is data to be processed inside the cs_event_log
table, we run a PL/SQL procedure to populate the data warehouse. We
use PL/SQL to maximize performance, since a considerable amount of
computation occurs in this step. The PL/SQL procedure performs
several major operations:
- First, it calls PL/SQL procedures that populate the pages,
referrers, and user_agents dimensions of the warehouse. These
procedures obtain a list of all entries in the appropriate dimension,
and compare this list of entries to the incoming data set. If there
is any data in the cs_event_log table that is not in the
dimension, the procedures insert the additional data. For instance,
there is one row in the referrer dimension for each unique
referrer. The cs_create_pages_and_referrers procedure scans
the cs_event_log table and inserts any new referrers into the
cs_dim_referrers table. Since SQL queries in PL/SQL against large
dimensions are quite slow (because of context-switching overhead), we
build dynamic PL/SQL procedures that cache all the necessary data
directly inside the PL/SQL procedure.
- Once the dimensions are properly populated, the fact table is
updated with any new facts.
- Once the necessary rows have been copied into the fact table, the
dynamic sitemap tree is created in the cs_sitemap table (see
the Sitemap section below.
Step 4: Analysis
Analyzing the data in the warehouse is extremely expensive -- not only
are there millions of rows to scan and aggregate, but joins against
one or more of the dimension tables are usually required as well. We
attempted to address these performance issues in several ways.
We attempted to maximize the amount of computation that was done
prior to querying, and cache the results of this precomputation. The
primary way we performed precomputation was through the use of
materialized views. Materialized views are views that precompute
aggregates and joins, storing the results in tables. As new rows are
inserted into the underlying tables, the materialized view can be
incrementally refreshed. Unfortunately, restrictions imposed by Oracle
on the use of materialized views preclude using materialized views for
every aggregate and join needed for queries. In addition, we had
substantial problems in getting materialized views to work
consistently, and we were forced to periodically recreate materialized
views from scratch, an extremely time-consuming process.
We also attempted to optimize the queries with data warehouse hints
such as /*+ STAR */, but, upon further analysis, we determined that
the performance of these queries was I/O bound, and that these hints
were not substantially improving the performance of the queries. We
believe that there is room in this area for substantial improvement,
since we were developing on a shared development machine with an
Oracle installation configured for OLTP.
Since the queries we were executing against the data warehouse grew
exponentially slower as more rows were loaded into the warehouse, we
decided to store only the results of analyses against the data. In
this new scheme, all the data in the data warehouse is deleted on a
daily basis, and clickstream data for the most recent 24-hour period is
loaded. This data are then analyzed; the results of each analysis is
stored in an HTML file for the given day. Thus the data warehouse
holds only the clickstream data for one day at any given time. The
price paid for the scalability, reliability, and performance that this
approach offers is that aggregation across multiple days becomes more
complex, and new reports cannot be performed on previously collected
data.
The Data Model
The cs_event_log table contains all the data that is directly
loaded into the warehouse with SQL*LOADER, and is identical in format
to the clickstream log files:
create table cs_event_log (
	event_id		integer,
	event_time		integer,
	end_time		integer,
	date_id			integer,
	url			varchar(4000),
	instance_id		varchar(4000),
	user_ip			varchar(50),
	user_id			integer,
	query			varchar(4000),
	bytes			integer,
	content_type		varchar(200),
	session_id		integer,
	browser_id		integer,
	user_agent_string	varchar(4000),
	accept_language		varchar(10),
	referring_url		varchar(4000),
	method			varchar(10),
	status			integer,
	secure_p		char(1)
);
The data warehouse itself is a standard star schema, and consists of a
single fact table and multiple dimensions. Note that the diagram below
illustrating the star schema shows only a subset of the dimensions that
we have in the data model.
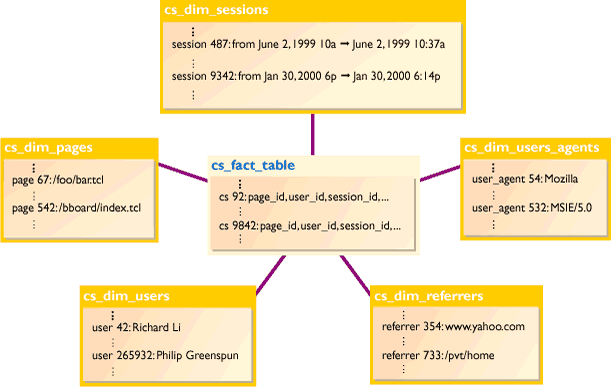
The granularity of the fact table is one page view. Each column of the
fact table that references a particular dimension is a foreign
key. The only way that data are entered into the data warehouse is via
the PL/SQL procedures. Since the PL/SQL guarantees the preservation of
the constraints, we disable all constraints to enhance performance.
We maintain the constraints in the data model in the disabled state so
that the Oracle cost-based optimizer can take advantage of this
information when it optimizes queries.
create table cs_fact_table (
	cs_id			integer primary key,
	-- load start/end, dwell time if able to determine
	load_start		integer,
	load_time		integer,
	dwell_time		integer,
	page_id			integer constraint cs_ft_page_id_fk references
		cs_dim_pages not null disable,
	-- which instance of the page is it?
	instance_id		varchar(3000),
	instance_provided_p	char(1) default 'f' not null check(instance_provided_p
		in ('t','f')) disable,
	referrer_id		integer constraint cs_ft_referrer_id_fk references
		cs_dim_referrers disable,
	date_id			integer
                                constraint cs_ft_date_id_nn not null disable
                                constraint cs_ft_date_id_fk references cs_dim_dates disable,
	session_id		integer
                                constraint cs_ft_session_id_fk references cs_dim_sessions
		disable,
	user_agent_id		integer
                                constraint cs_ft_user_agent_id_fk references
		cs_dim_user_agents disable,
	user_ip                 varchar(50)
                                constraint cs_ft_user_ip_nn not null disable,
	browser_id		integer,
        user_id			integer,
	-- HTTP method (GET, POST, HEAD)
        method                  varchar(10)
                                constraint cs_ft_method_nn not null disable,
	-- HTTP status code
        status                  integer
                                constraint cs_ft_status_nn not null disable,
        bytes                   integer,
	content_type		varchar(200),
	-- might want to turn accept_language into a dimension?
	accept_language         varchar(10),
	secure_p		char(1)
                                constraint cs_ft_secure_p_nn not null disable,
                                constraint cs_ft_secure_p_ck check(secure_p in ('t','f'))
		disable,
	-- how many css into the session are we? 1, 2, 3...
	cs_within_session	integer,
	user_state_id		integer
                                constraint cs_ft_user_state_id_fk references cs_dim_user_state
		disable
);
The cs_dim_user_agents dimension is an example of a typical
dimension in the clickstream data warehouse. This dimension records
information about the particular user agent for each particular HTTP
request:
create table cs_dim_user_agents (
	user_agent_id		 integer
                                 constraint cs_dua_user_agent_id_pk primary key,
	-- The string returned by the browser
	user_agent_string	 varchar(3000) not null,
	-- Mozilla, Opera, IE
	browser_type		 varchar(3000),
	browser_version		 varchar(3000),
	-- The major part of the browser version. For MSIE and Mozilla, this is just
        -- the first three characters.
	browser_version_major    varchar(3000),
	-- MacOS, Win32, Unix
        operating_system	 varchar(50),
	-- MacOS 8, Windows 95, Windows 98, Windows NT, Linux, Solaris, etc.
	operating_system_variant varchar(50)
);
The current data model includes the following dimensions:
- Page dimension: What was the name of the page requested?
What type of page was requested? What was the url? What was the
content type?
- Referrer dimension: What kind of referrer was it (e.g.,
search engine)? What was the referring url? What search text, if any,
was used? If it was from inside the site, what is the referring page
id?
- Date dimension: Which day of the week was the request? Day
in the month? Day in the year? Which week in the year?
- User agent dimension: Which browser is the user using?
Which version? Which operating system?
- Session dimension: When did a particular session start?
When did it end? Which user? How many clicks were part of the session?
What was the total value of the sales in the session?
- User state dimension: What is the current value of the
shopping cart?
- User demographics dimension: What is the income level of
the user? What is his/her race?
An example analysis: the dynamic sitemap (screenshot)
The dynamic site map illustrates the most popular paths users follow
when navigating the site. For each page in the site, we determine
which page is the most common referrer to that page. If this "best
referrer" is external, the page shows up as a root-level node in the
sitemap (since people typically get to the page from some external
source); if the best referrer is internal, the page shows up beneath
that referrer in the sitemap tree.
cs_create_sitemap builds this tree breadth-first:
first it inserts into the sitemap all pages which belong in the top
level (i.e., have an external "best referrer"). Then it inserts into
the second level of the sitemap any pages that have a top-level node
as a best referrer; then it inserts any pages which have a
second-level node as best referrer, etc. It loops until it can't
insert any more nodes.
When this process is complete, there may still be some pages which
haven't been inserted into the tree: consider the case where two pages
have each other as best referrers. When cycles such as these occur, we
pick the node in the cycle which is most commonly hit (call it
X), and we delete as potential parents all other nodes in the
cycle. We then continue the loop described in the previous
paragraph. The node X is guaranteed at this point to be
inserted somewhere in the site map, since none of the nodes in the
cycle can possibly be X's best referrer any more. We repeat
this process until all cycles are resolved.
The end result is a dynamically built sitemap illustrating the paths
users most frequently take navigating the site.
An example query: Entry Pages (screenshot)
How users typically enter a web site is a common question for web site
operators. We can easily answer this question with a single query:
select    p.page_id, p.page_url name, count(*) value
from      cs_fact_table f, cs_dim_pages p, cs_dim_sessions s
where     f.page_id = p.page_id
and       f.session_id = s.session_id
and       f.cs_within_session = 1
and       p.exclude_p = 'f'
and       s.clicks > 1
group by  p.page_id, p.page_url
order by  3 desc
This query performs a join between the main fact table and two
dimension tables, the cs_dim_pages table and the cs_dim_sessions
table. Let's dissect the remaining where clauses:
f.cs_within_session = 1
ensures that the page_id retrieved is the first page clicked in a
given session
p.exclude_p = 'f'
excludes requests that should not be counted (e.g., requests for
images)
s.clicks > 1
ensures that
we are only analyzing sessions that have registered more than one page
request. We throw away one-hit sessions because we cannot distinguish
between first time visitors who hit the web site once and visitors who
have non-cookied browsers. If we included one-hit sessions, our data
would be skewed by non-cookied visitors who are browsing the site,
since every page request from these visitors would look like an entry
page.
Future work
Several of our clients currently use our clickstream data warehouse
architecture, and rely on it to answer many of the important business questions
described in the overview. We plan on improving the architecture by:
- Refining and developing a comprehensive set of queries that answer
most of the questions that users want.
- Extending the data population code to include all dimensions in
the data model and determining what additional dimensions should be
added.
- Defining a standard way to extend the data model by adding custom dimensions,
or augment existing ones; and
developing a mechanism to transfer additional data necessary to populate these extra fields
from the production web server to the database.
- Validating the data collected and analyzed by comparing the
results against other log analyzers.
A development snapshot of the clickstream software discussed in this
article is
available for download.
asj-editors@arsdigita.com
Related Links